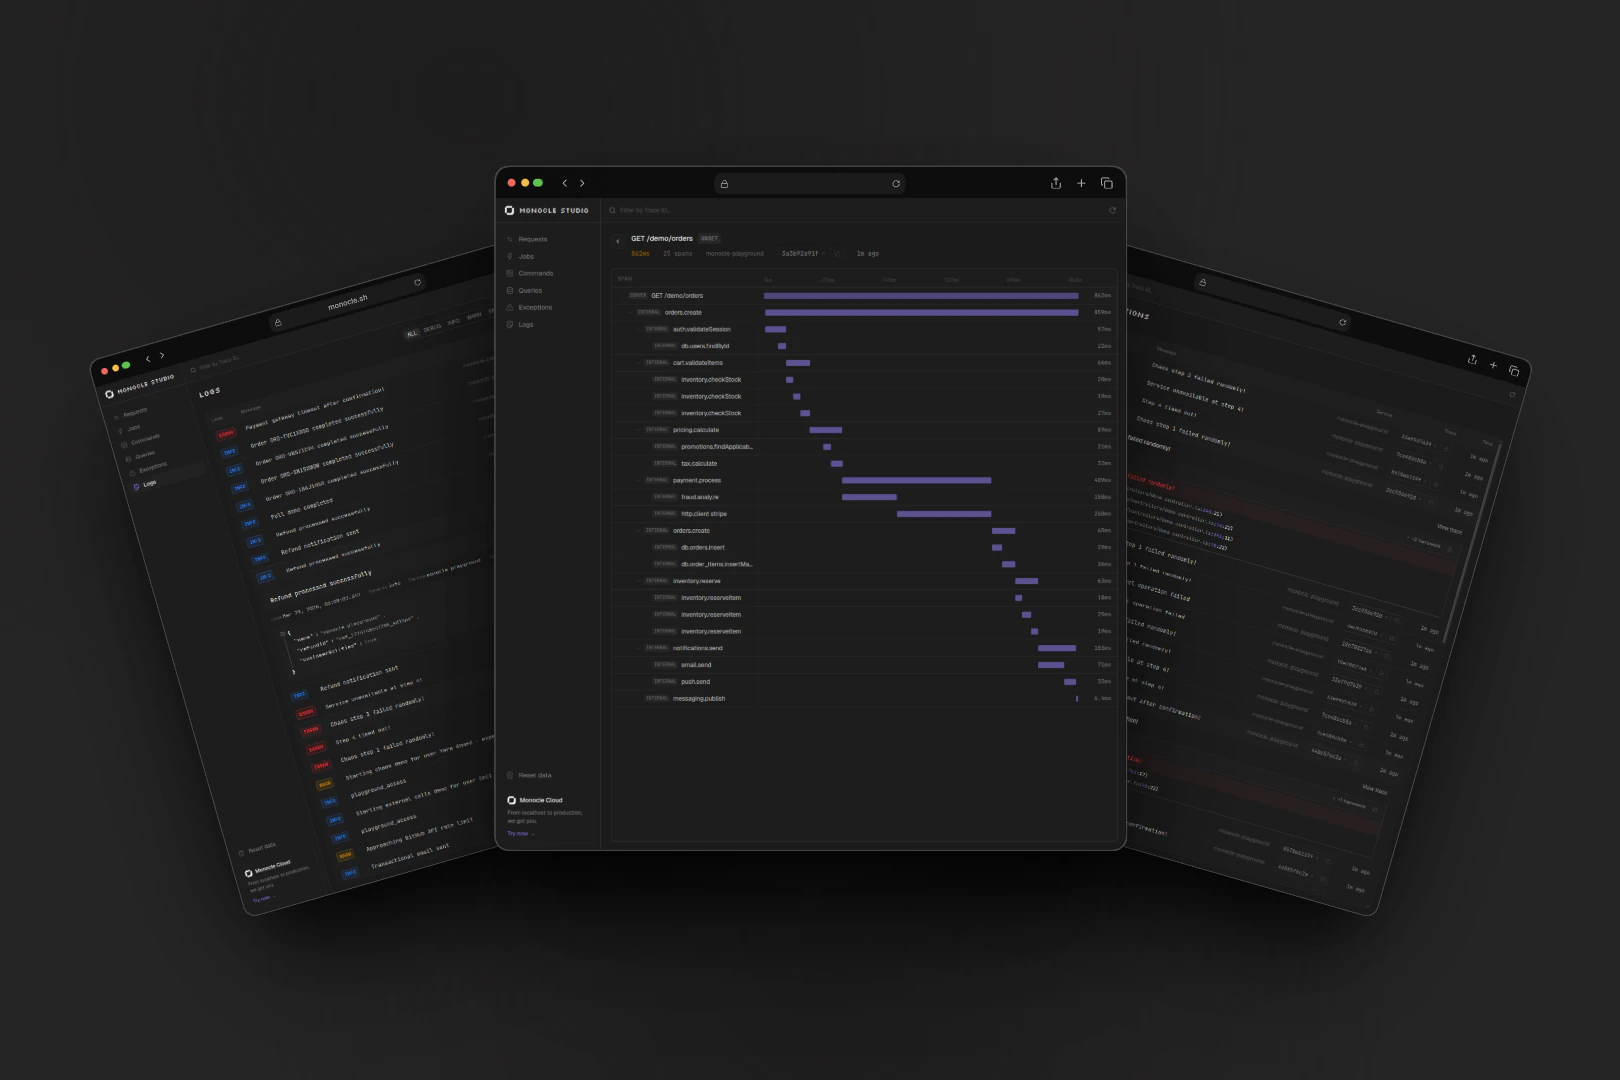
- See the full trace waterfall for every request
- Track outgoing HTTP calls to external APIs
- Spot slow queries before they become production issues
- Browse structured logs with stack traces and JSON attributes
- Catch exceptions before they ever reach your users
- Connect your AI coding assistant via MCP to query your traces
How it works
Your app uses the same Monocle agent as in production. In development, the agent automatically sends telemetry to Monocle Studio instead of the cloud. Studio receives it, stores it locally, and serves a dashboard — all on a single port (localhost:4200). Data persists between restarts so you can review past sessions.
Features
Traces & Requests
HTTP requests with full span waterfall, timing, and attributes
Logs
Structured logs with severity filtering, JSON viewer, and stack traces
Exceptions
Exceptions with stack traces, grouped by type
Database Queries
SQL queries with duration and statement preview
External Calls
Outgoing HTTP calls to external APIs with domain, status, and duration
Background Jobs
Job execution, queue name, duration, and success/failure tracking
CLI Commands
Traces for CLI scripts and scheduled tasks with custom spans
MCP Server
Let Claude Code or Cursor query your local traces and logs
Real-time
New data appears instantly — no manual refresh needed
Quick start
1
Install
2
That's it
Dev mode activates automatically when
NODE_ENV=development (the default in AdonisJS during node ace serve). No extra config needed — the agent detects it and sends data to Monocle Studio instead of the cloud.3
Install agent instructions
AGENTS.md or CLAUDE.md so your agents know about Monocle Studio and how to use it.4
Start Monocle Studio
http://localhost:4200.5
Start your app
http://localhost:4200 to see your traces, logs, and exceptions.CLI options
CLI commands
You can also query Studio data directly from your terminal without opening the browser. Fetch traces, logs, and errors withmonocle studio traces, monocle studio logs, and monocle studio errors. See the CLI reference for all options.
Desktop app
Prefer a native app over a terminal command? Monocle Studio is also available as a standalone desktop application for macOS, Linux, and Windows — with system tray support and auto-updates.Data storage
Monocle Studio stores data locally at~/.config/monocle/studio.db. Data persists between restarts. Use monocle studio dev --clean to start fresh.